
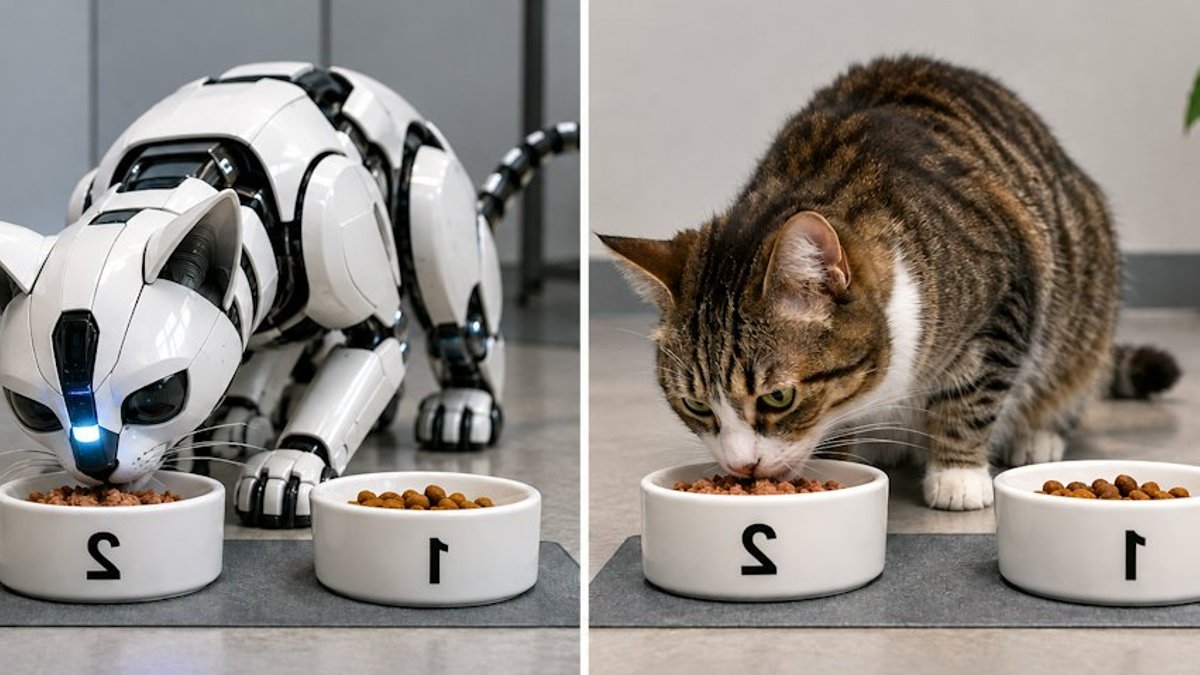
A new study suggests electronic nose technology could help pet food manufacturers quickly assess cat food aroma profiles before running costly animal preference tests. Researchers compared the performance of an electronic nose, equipped with 18 metal oxide sensors, against actual feline feeding trials to determine whether aroma patterns matched consumption habits.
How the electronic nose works
The study, published in Chemosensors, tested nine commercial dry cat foods from three brands, each offering chicken, lamb, and tuna flavors. Researchers analyzed volatile compounds in each food sample, generating digital aroma “fingerprints” for comparison. The electronic nose distinguished products by both brand and flavor, though brand-specific differences were more pronounced than flavor variations within the same brand.
For example, when classifying foods by brand within each flavor, the system achieved 99.2% to 100% accuracy. However, when distinguishing flavors within a single brand, accuracy varied: 98.4% for Brand A, 91.3% for Brand C, and 81% for Brand B. The study noted that brand differentiation likely stemmed from formulation and manufacturing differences rather than labeled flavor alone.
The researchers collected about 1 gram of each food sample and measured volatile compounds over 10 days, producing 270 total measurements across nine products. This approach allowed for consistent, repeatable aroma profiling without relying on live animal testing.
Read Also: Purina opens $550 million pet food plant in Ohio
Alignment with real cat preferences
Seven domestic shorthair cats participated in preference tests, where they were given three foods per eight-day period. The results showed Brand A, classified as premium, had the highest average consumption (42.31%), followed by Brand C (34.63%) and Brand B (23.05%). Within Brand A, chicken flavor led consumption (69.93%), while Brand B’s chicken flavor was the least preferred (20.61%).
The electronic nose’s aroma fingerprints mirrored these trends. Differences among brands within the same flavor were greater than differences among flavors within a single brand, suggesting that brand-specific aroma signatures influenced cat preferences more than flavor alone. The researchers emphasized that while aroma patterns aligned with consumption data, the study did not prove aroma was the sole factor driving preference.
In practice, this technology could reduce the need for extensive animal trials during product development. Manufacturers might use electronic noses to screen aroma profiles before investing in full-scale preference testing, potentially speeding up formulation adjustments. The study acknowledged, however, that further validation with independent production batches would be required before the method could replace animal testing entirely.


